Briefing: CBAM is driving immediate investment imperatives for selected exporters
Feb 2026 by Pinea Partners
Executive Summary
The EU’s Carbon Border Adjustment Mechanism (CBAM) represents a fundamental shift in global industrial competition. By embedding carbon cost into cross-border trade, it extends climate policy beyond domestic regulation and directly reshapes the economics of carbon-intensive value chains. For producers, importers, and governments, competitiveness is no longer determined solely by cost, quality, and security, but increasingly by verified carbon intensity and exposure to local carbon pricing. This briefing examines the strategic implications of CBAM across key stakeholder groups and outlines the emerging response pathways available to industry. In addition, it presents a detailed data analysis and forward-looking forecast of CBAM liabilities across international industrial clusters, providing an innovative view of carbon cost exposure at a regional production level. Through a number of case studies of Clusters at Risk, the strategic assessment and quantitative modeling offers a practical insight in how Pinea Partners supports decision-makers navigating Industrial Transition in the global markets.
1. About the Carbon Border Adjustment Mechanism
CBAM is the European Union’s flagship climate-related trade policy designed to put a fair and transparent price on the carbon emissions embedded in certain imported goods, aligning the carbon cost faced by foreign producers with that of EU manufacturers under the EU Emissions Trading System (ETS) [1]. Originally established by Regulation (EU) 2023/956 adopted in May 2023 as part of the European Green Deal, CBAM entered a transitional reporting phase in October 2023 and is set to operate in its definitive regime from January 1, 2026, requiring importers of carbon-intensive products like steel, cement, aluminum, fertilizers, hydrogen and electricity to surrender carbon certificates linked to embedded emissions [2]. In October 2025, the EU adopted Regulation (EU) 2025/2083 (the CBAM Simplification/Omnibus Regulation), which amends the original text to simplify compliance, introduce a 50-tonne de minimis threshold for small importers, and reduce administrative burdens while maintaining environmental integrity [3]. Complementary implementing and delegated acts published in December 2025 provide detailed rules on emissions calculation, customs procedures, verification standards and certificate pricing to operationalize the mechanism [4]. CBAM is intended to prevent carbon leakage, protect EU industry competitiveness, and incentivize cleaner production globally, while remaining WTO-compliant and responsive to trade and climate policy dynamics.
2. CBAM impact by exporting country and sector
Taking into consideration EU imports by product by country as reported under the CBAM transition phase for the year 2025, coupled with the default emission factors set forth by the December 2025 Implementing Act, we can project total exposed emissions. The Figure below summarizes this emission exposure in a heatmap without any phase-in discount factor. This would be representative of the steady state without any change in trade flows or emission factors.
2.1 CBAM Exposed Emissions (CO2e)

This Figure clearly shows that the majority of CBAM covered emissions are expected in the Steel & Iron sector. Summing total exposures, countries including China, Turkiye, Indonesia, Russia and India carry significant notional impact. Whether this will influence their relative competitiveness depends on availability of alternative supply and the proportional price increase that CBAM represents to importers.
- EU27 countries imported ~9 million tons of Steel & Iron CN8 product codes from China in the period Jan – Nov 2025 [7].
- These imports contain an estimated ~47 million tons of CO2e CBAM embedded emissions [6].
- Assuming a carbon price difference of 100 EUR / t, these emissions imply a financial exposure of ~4.7 bn EUR per annum (“CBAM liability”) as of 2034 (full-phase in).
- This liability represents a 35% premium to the EUR value of these imports (13.4 bn EUR) under a business as usual (BAU) scenario by 2034.
2.2 CBAM Financial Liability (EUR)
To assess where CBAM emission exposure is likely to have a material impact on global trade flows, we have compared all estimated CBAM levies (CN8 product by country [6]) to the value of the respective import flow.

2.3 The effect of domestic carbon pricing schemes
Almost all key exporting partners of the EU are in the process of adopting domestic carbon pricing schemes that will serve as a countermeasure to CBAM. For instance China, Indonesia, Turkiye and India have recently made significant progress on covering some of the world’s most polluting industrial clusters. Note that although carbon prices paid locally can be deducted from the CBAM liability, for sectors that cannot pass costs on to the importer the burden will remain with the producer. Exactly how such pricing power plays out will depend on the SnD. Furthermore, CBAM can impact local economies significantly even at a small scale of absolute covered emissions. For instance, the emission exposure of Egypt Fertilizers is almost 10x smaller than that of China Steel & Iron, but its relative price increase is on equal footing (China ~4.7 bn EUR liability (+35%) and Egypt ~0.5 bn EUR liabilty (+34%)). Relative sector concentration and available technology, ecosystem and time to decarbonize will ultimately decide which Industrial Clusters are affected most as CBAM phases in to these exposure levels the coming years.
3. Industrial Clusters at Risk
SE-Asia
North Africa
Gulf
Turkiye
Kazakhstan
China
4. Structural implications for Competitiveness
CBAM is designed to avoid carbon leakage, creating a level playing field for EU producers under the EU carbon pricing scheme. By forcing a global carbon price on EU produced and imported goods, this should on average shift some competitive strength away from non-EU producers currently underpaying for environmental pollution. We consider structural implications of CBAM on the competitive position of key actors.
Non-EU Producers
- Carbon intensity becomes a pricing factor. EU market access increasingly depends on verified embedded emissions, not just cost and quality.
- Low-carbon producers gain structural advantage. Efficient EAF/renewable-powered routes can preserve margins; high-intensity producers face compression or diversion.
- MRV capability becomes strategic. Inability to provide credible data risks default values and loss of competitiveness.
- Investment pressure accelerates. CBAM strengthens the business case for decarbonization CAPEX and cleaner inputs at producers currently operating at high emission factors.
Non-EU Governments
- Potential increase of trade tension. CBAM may reshape trade alliances and policy coordination.
- CBAM externalizes EU climate policy. Export competitiveness becomes linked to domestic climate frameworks.
- Incentive to introduce or strengthen carbon pricing. Alignment can mitigate trade disadvantage.
- Industrial policy response accelerates. Support for low-carbon production and MRV infrastructure becomes strategic.
EU Importers
- Procurement shifts to “CBAM-inclusive cost.” Sourcing decisions incorporate carbon exposure alongside price, with average price increases expected.
- Compliance capability becomes a competitive strength. Strong reporting systems and supplier alignment reduce risk and disruption.
- Supplier consolidation likely. Preference for verified, lower-intensity producers.
- Margin volatility increases. Exposure to carbon price movements introduces new cost uncertainty.
EU Governments
- Expansion of CBAM scope is logical. Gradually include downstream products to prevent circumvention and leakage shifts (expected as early as 2027).
- Revenue reinvestment becomes trade policy instrument. Direct proceeds to industrial decarbonization and competitiveness support.
- Opportunities to accelerate global climate policy. Promote carbon pricing convergence and climate club cooperation.
- Enhanced responsibility to ensure price stability. Provide long-term ETS/CBAM predictability to support investment certainty.
5. Strategic moves for non-EU producers
Strategy A: Preservation
Description: Focus on meeting CBAM reporting requirements and passing through carbon costs without materially changing operations.
What it takes: Basic MRV capability, contractual pass-through mechanisms, and acceptance of potential margin pressure / volume loss.
Strategy B: Differentiation
Description: Position low-carbon products, verified emissions data, local carbon price value and embedded CBAM price solutions as a value proposition to EU customers.
What it takes: Robust plant-level emissions tracking, transparent certification, and commercial integration of CBAM-inclusive pricing.
Strategy C: Decarbonization
Description: Reduce embedded emissions through process upgrades and clean energy to secure long-term EU competitiveness.
What it takes: Significant CAPEX, access to low-carbon power and inputs, government alignment, and multi-year strategic commitment.
6. Conclusion
CBAM marks a structural shift in EU competitiveness of several carbon-intensive industrial clusters. Pinea Partners has made detailed forecasts for expected CBAM liabilities in 2027 – 2034 relative to import value. South-East Asia, China and the MENA region are hit hard on basic industries central to their recent economic growth. Cost, quality, and security remain critical, but verified carbon intensity is becoming an additional determinant of market access and supply chain resilience. For EU trade partners, it is time to make strategic choices: preserve existing positions, differentiate through carbon performance, or structurally decarbonize to secure long-term advantage. The relative winners will be those that treat CBAM not merely as a compliance mechanism, but as a catalyst for repositioning in the global economy. Pinea Partners is ready to support importers, industrials and governments shape their strategic response.
- https://taxation-customs.ec.europa.eu/carbon-border-adjustment-mechanism_en
- https://eur-lex.europa.eu/legal-content/EN/TXT/?uri=CELEX%3A02023R0956-20251020
- https://eur-lex.europa.eu/legal-content/EN/TXT/?uri=OJ:L_202502083
- https://taxation-customs.ec.europa.eu/carbon-border-adjustment-mechanism/cbam-legislation-and-guidance_en
- Regulation (EU) 2023/956, OJ L 130, 16.5.2023, Art. 31 and Annex V; see also Directive (EU) 2023/959 amending Directive 2003/87/EC
- Based on adopted CN8 country-specific emission factors for 2027 default values including applicable mark-ups (v20260204)
- Eurostat dataset “EU trade since 1988 by HS2-4-6 and CN8” retrieved Feb 17 2026
Thanks to the December 2025 updated Delegated Acts, the rules on emissions calculation and CBAM certificate pricing are now clear. Thereby focus now shifts on implementation and importers are ready to execute on their liabilities. These liabilities stem from embedded emissions in eligible products. For those embedded emissions, importers are expected to procure CBAM certificates directly from the European Commission. These certificates are bankable, but not tradable in secondary markets. The compliance process for designated EU importers is illustrated in the Figure below.
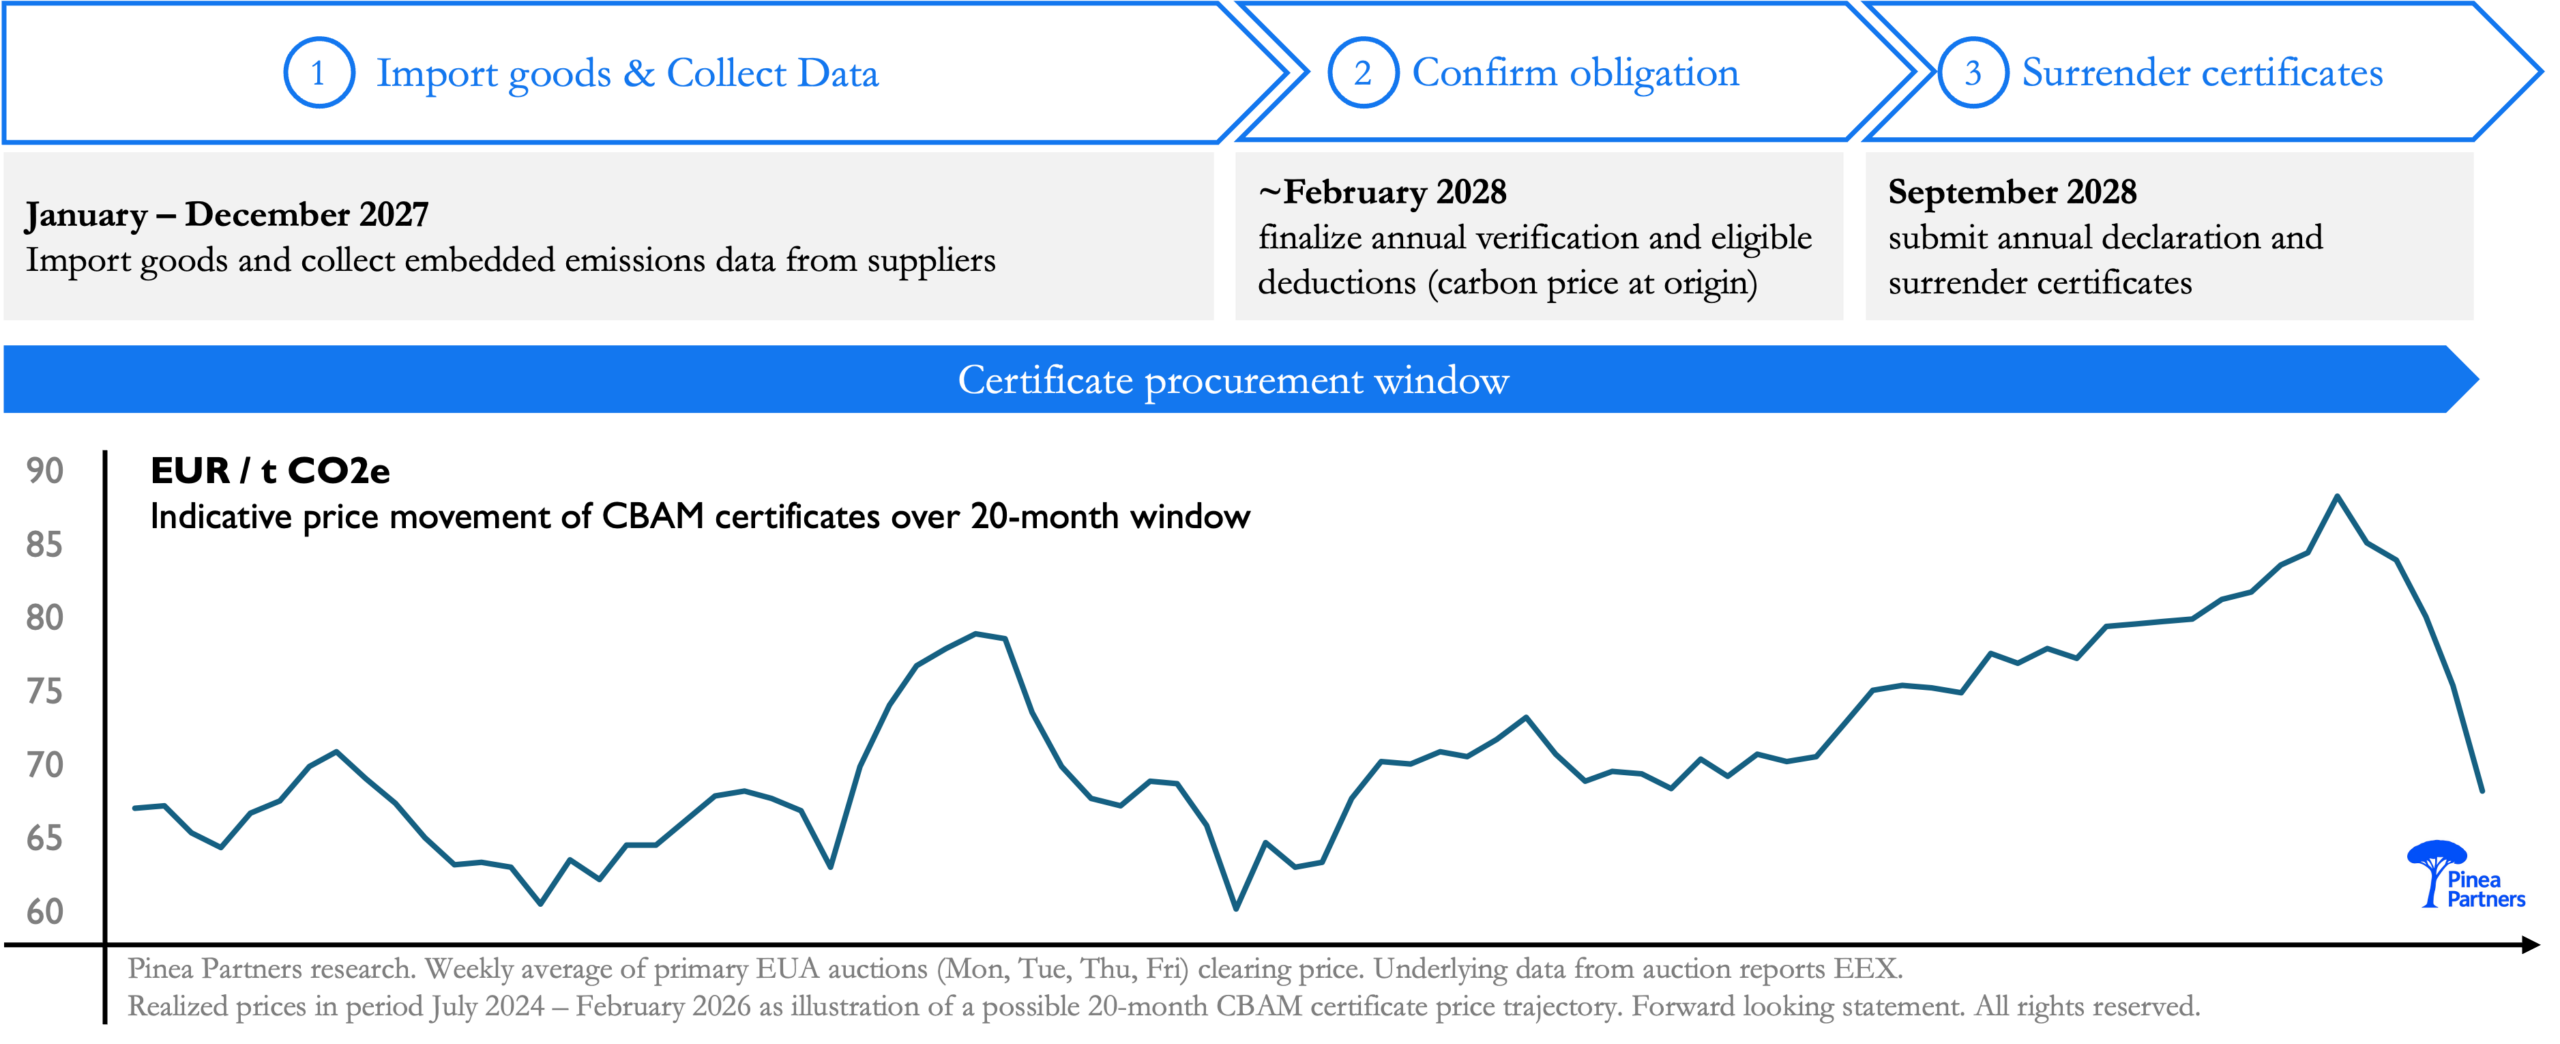
- As of 1 January 2027, authorized CBAM declarants must monitor imports and collect emissions data for covered goods, using verified primary data from non-EU producers where available or default emission factors under EU rules.
- From 1 February 2027, they must begin purchasing CBAM certificates via the EU’s central platform and maintain sufficient holdings during the year, with prices set weekly based on the average EU ETS auction clearing price.
- By 30 September of the following year, they submit their annual CBAM declaration and surrender certificates corresponding to verified embedded emissions, adjusted for any recognized carbon price paid in the country of origin.
The Figure illustrates the annual compliance mechanism starting in 2027. Note that for the first compliance year of 2026 different rules apply, namely: procurement as of February 2027, quarterly average pricing, and compliance by September 2027. Remark that while the CBAM certificate price is directly linked to the EU ETS price, CBAM certificates and EU Allowances (EUA) are not interchangeable.
B.1 CBAM liability for any given importer
For a single imported product, CBAM liability equals its verified embedded emissions multiplied by the EU carbon price, net of any recognized carbon price already paid in the country of origin. Embedded emissions are calculated as the product of imported quantity and the applicable emission factor, based either on verified installation-level data or, where primary data are not used, default values under CBAM rules. The resulting cost therefore reflects both the product’s carbon intensity and the effective EU–foreign carbon price differential. Below we summarize how the total CBAM cost will be determined annually as of 2027, with the pricing for 2026 determined in a slightly different way.
Where:
- = quantity of imported product
- = embedded emission factor (tCO₂e per unit)
- = weekly average EU ETS auction clearing price (EUR/tCO₂)
- = recognised carbon price paid in the country of origin (EUR/tCO₂)
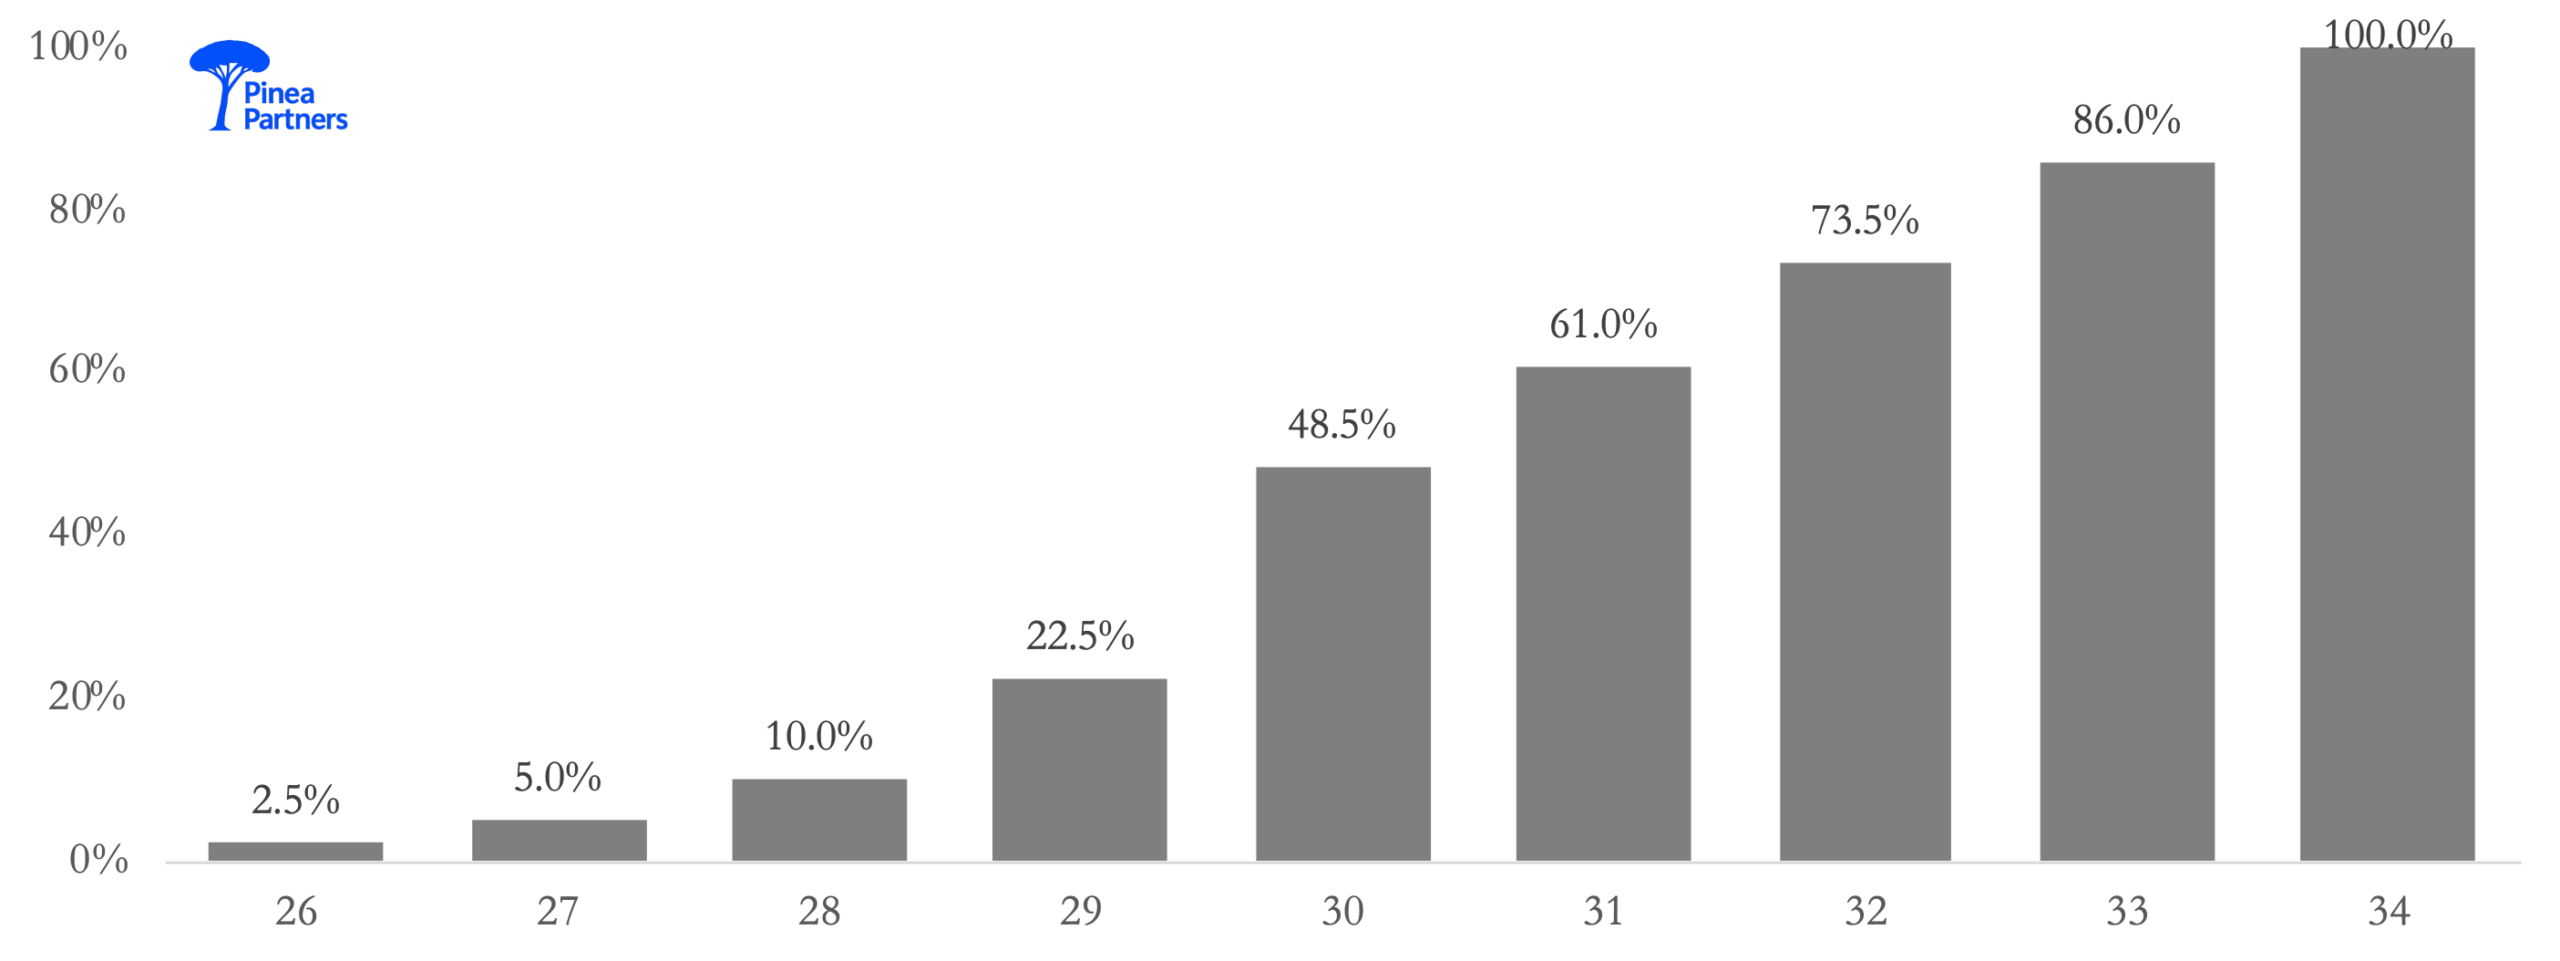
B.2 Phase-in of liability 2026 – 2034
To avoid market disruption, CBAM is phased in gradually by discounting the emission factor EF. This phase-in of CBAM corresponds to the phase-out of EU ETS free allowances. The Figure below illustrates the phase-in % as adopted by the European Commission [5].
About this briefing
Copyright Pinea Partners B.V.
Subject to our Legal Disclaimer.
Terms of Use apply.
Subscribe to our Briefings?
Email us at
briefings@pineapartners.com
Would you like to discuss further?
Speak to our experts at
contact@pineapartners.com